Agile Estimation Cheat Sheet & Control Charts (Relative sizing techniques)
One of the main questions that I hear from new starters when first introducing them into the Sprint Refinement process of estimation is "I'm new and i'm not quite sure how this team estimates or what I should size this story?" There are some ways to speed up this process with your new starters and also provide some bumper rails to your team members.

- Control Chart
- Agile Estimation Cheat Sheet
Now, like everything in the agile environment, there is not one correct way to do something. This is just one of the many methods that I have tried out.
The Goal
See completed stories, time spent in different transition statuses and how they relate to the original story point estimate to provide context for new starters and existing team members.
The disclaimer: Story points should not to be mapped directly to the amount of time it takes to complete. It is a rough guide based on a sequence of numbers and a gut feeling with all of the information present at the time of estimation, including any assumptions.
The Solution
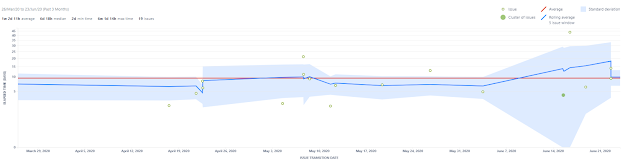
Using JIRA control chart and quick filters with story point size, it is possible to understand cycle time of stories from start to finish within a specified date range.
For example "Show me all of the completed stories in the last 3 months with a 3 points estimate"

This shows me the following insights:
- Average time
- Median time
- Issue count
- Examples! - The most important of them all

As mentioned, this is just one of the many ways to help your team members out with understanding what relative story sizing looks like. Put your own spin on it or work with your team to find out what will suit them best, and remember don't hold team members accountable for timings, instead find out ways your can improve over time and provide more accurate estimates.
Comments
Post a Comment